.svg)
.svg)


Illustration: Simone Noronha
They may look intimidating at first, but spectrograms are a fun and useful way to visualize sounds and understand just what they’re made of.
These visual graphs break down an audio signal into all of its individual frequencies, from low, booming sub-bass to high-frequency chirps and clicks. Being able to “see” sound in this way makes the spectrogram an incredibly valuable tool for tasks like mixing, mastering, editing, and even touching up or repairing audio.
In this introductory guide, we go over what a spectrogram is, how to analyze them, and why they’re valuable for anyone who’s looking to analyze audio on a deeper level.
Feel free to use the table of contents below to easily navigate to a specific section.
What you’ll learn:
Let’s get started!
What is a spectrogram?
A spectrogram is a visualization of the spectrum of frequencies of a signal as it varies with time.
Chances are, if you’ve opened up a DAW, you’ve probably already seen real-time audio represented as a frequency “spectrum” before—perhaps in Ableton Live’s Spectrum plugin or in the background of many an EQ plugin. You’ll notice these graphs are constantly changing because they’re only showing a “snapshot” of frequencies in that exact moment.
On the other hand, a spectrogram takes things one step further and shows how that frequency content evolves over time.
How to read a spectrogram
So how do we read a spectrogram? Typically, spectrograms are represented as graphs where one axis (usually the x-axis) represents time, the other axis (usually the y-axis) represents frequency, and the color or intensity of the markings indicate the amplitude of a particular frequency at that point in time.
These images—which we’ll examine below—can be created in a few different ways, including sending the audio through a set of band-pass filters, or using a mathematical function called a Fourier transform. These processes aim to split the incoming signal into a bunch of individual frequency bands and show us the underlying DNA of that sound.
What a spectrogram shows: Looking at some examples
A picture is worth a thousand words—let’s compare some spectrograms of different instruments and see what they tell us about each one.
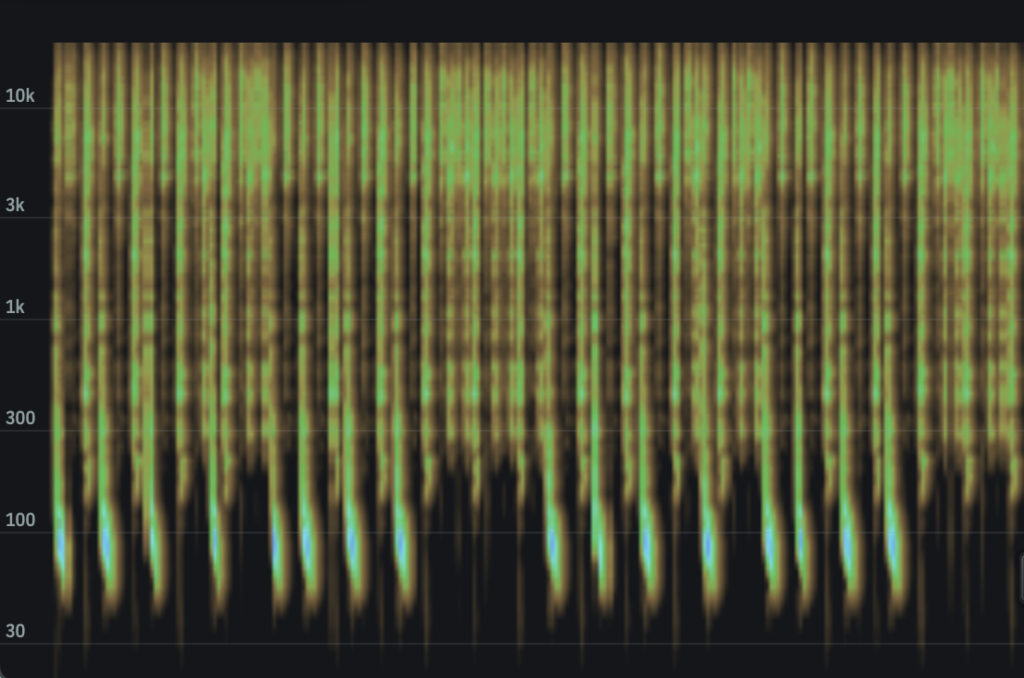
1. A bass guitar riff

Reading from left to right (remember, the x-axis is time), each column of horizontal markings represents a single note in the pattern. Why are there multiple lines stacked on top of each other, you might ask? That’s because many sources of sound don’t just produce a single frequency—instead, they produce many other higher frequencies commonly called overtones or harmonics.
Note that there isn’t much going on above 300 Hz, given that bass guitars primarily put out low frequencies.
2. A violin part

Similar to the bass guitar, we’ve got individual notes left-to-right that each have their own sets of harmonics. However, unlike the bass guitar, most of the content is in the upper range of audible sound (1 kHz and above).
You can also see how the root frequency of each note (also called the fundamental frequency) is the most prominent due its bright color, while the higher overtones gradually decrease in their intensity. It’s these collections of frequencies that make up a violin’s unmistakable sound.
3. A breakbeat drum pattern
Let’s switch things up with something non-harmonic like a drum beat—you’ll immediately notice it’s quite a bit different than the previous spectrograms. We have much shorter, percussive hits illustrated by the many vertical lines, and these hits also don’t share the distinct overtones of melodic instruments like the violin or bass guitar. This is because the energy of percussive sounds like drums is more spread out over the entire frequency spectrum (y-axis), but usually restricted to shorter intervals of time (x-axis).
4. White noise

Let’s finish things off with some good old white noise, which spreads its frequencies as equally as possible over the whole spectrum. I like to think of white noise like white light—it’s a combination of every color / frequency that results in a steady, static sound.
Conclusion
Spectrograms are widely used in a number of fields including seismology, linguistics, sonar / radar, and speech processing to analyze both audio and other types of signals. Music software like iZotope’s RX and Steinberg’s WaveLab employ spectrogram visualizations to help users achieve better mixdowns and even perform advanced audio restoration on low-quality recordings to remove unwanted noises or artifacts. That’s part of the magic of working in the frequency domain—we can uncover so many more details about a sound that we wouldn’t have been able to access as easily with other means.
Do you have any questions about spectrograms? What other topics in audio technology would you like to see us break down next? Start a conversation with us and an ever-growing community of music creators via the Splice Discord.
Try experimenting with spectrograms with iZotope’s RX for free, and then rent-to-own the plugin until you own it outright:
August 6, 2024


