.svg)
.svg)


When you drop a drum loop into your project or record some vocals with a microphone, chances are it’s going to be represented as a waveform in your DAW.
But what if there were other ways to visualize audio signals—ways that let you look more closely at the sound and understand what it’s really made of? The frequency domain unlocks information about our sounds that’s unique from what the time domain offers. Below, we share what the frequency domain is and how analyzing it can be useful to us.
The time domain vs. the frequency domain
Let’s take a quick step back first. Your trusty old waveform is represented in the time domain, in which the amplitude of a signal is measured as a function of time. Amplitude in turn measures vibration, which produces sounds that we can listen to. This is shown as voltage in something like an analog synth or a mixing console, and as values between 1 and -1 in the DAW.
Most of the time, we’re looking at waveforms in the time domain because it’s a straightforward way of representing a sound as a single, continuous vibration. This makes a lot of audio tasks like chopping, rearranging, and fading more intuitive.
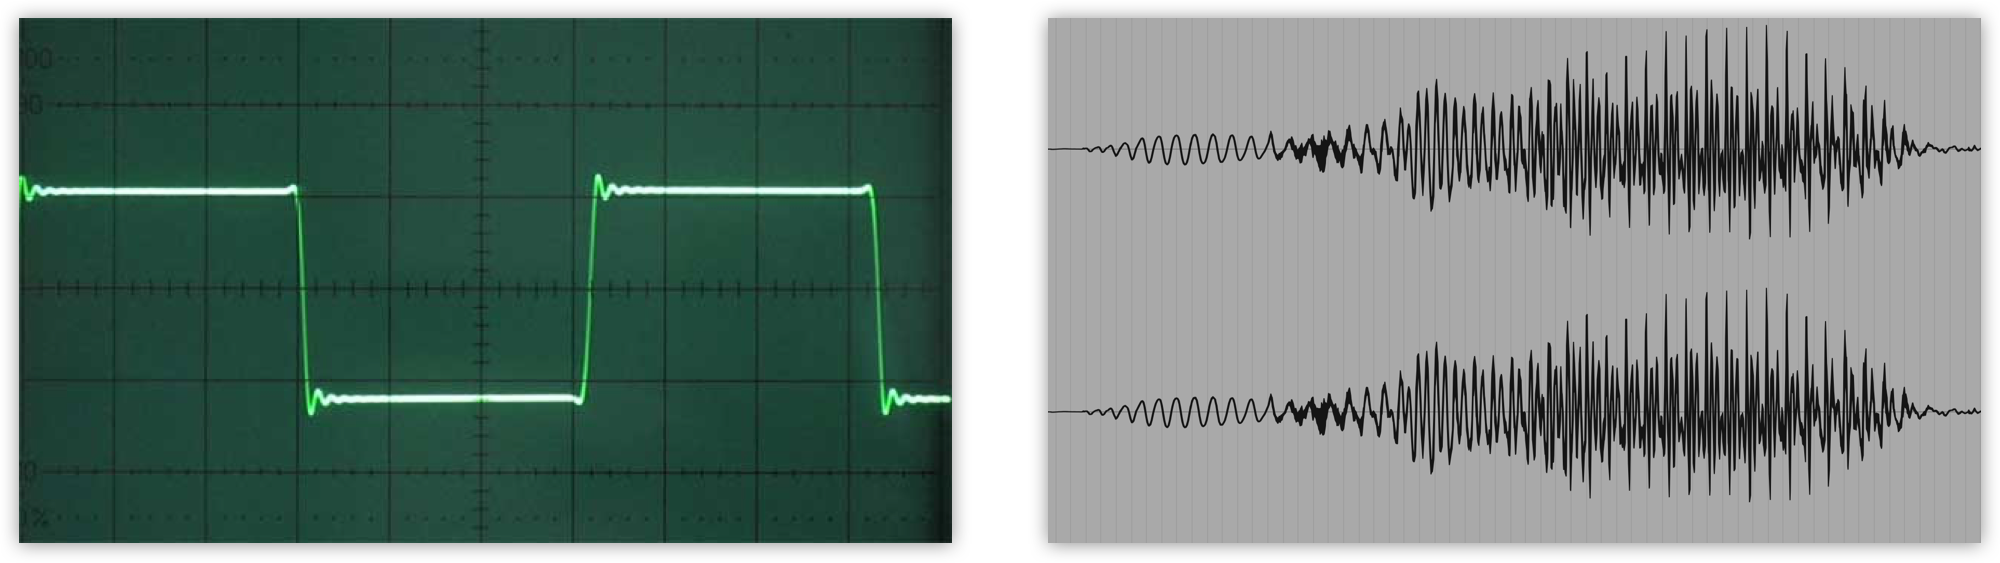
A square wave run through an oscilloscope (left) and a vocal waveform in Ableton Live (right).
What is the frequency domain?
Then we have the frequency domain, which is where things start to get really interesting. Rather than looking at sound as a single vibration, what if we broke it down into a collection of individual frequencies?
A Fourier transform is one way to accomplish this. It works on the principle that any sound at any point in time can be represented as the sum of many different sine waves. Think of it as taking additive synthesis to the max—a sawtooth wave from a synthesizer and a dog bark can both be split up into the same building blocks (sine waves), just like how a C major triad can be broken down into the notes C, E, and G.
This may come as a surprise, but you’re actually working in this dimension every single time you use a plugin like Ableton’s Spectrum or one of many EQ plugins that show the frequency spectrum of incoming audio.

The frequency spectra of a square wave (left) and human vocals (right).
The time-frequency domain: The best of both worlds
One limitation of pure frequency domain analysis is that most sounds aren’t periodic—they constantly change. As a result, you’re only really able to see what makes up a sound during a single snapshot or interval in time.
So, what happens if we try to combine these domains, and look at the spectral (frequency-based) content of audio over time, rather than at a specific moment? You enter the time-frequency domain, which allows us to do some really magical stuff with sound.
For example, audio restoration tools like iZotope’s RX 10 work in this dimension by analyzing incoming audio files and outputting a special image called a spectrogram, a graph that displays all of the frequencies (on the y-axis) and how they change over time (on the x-axis).
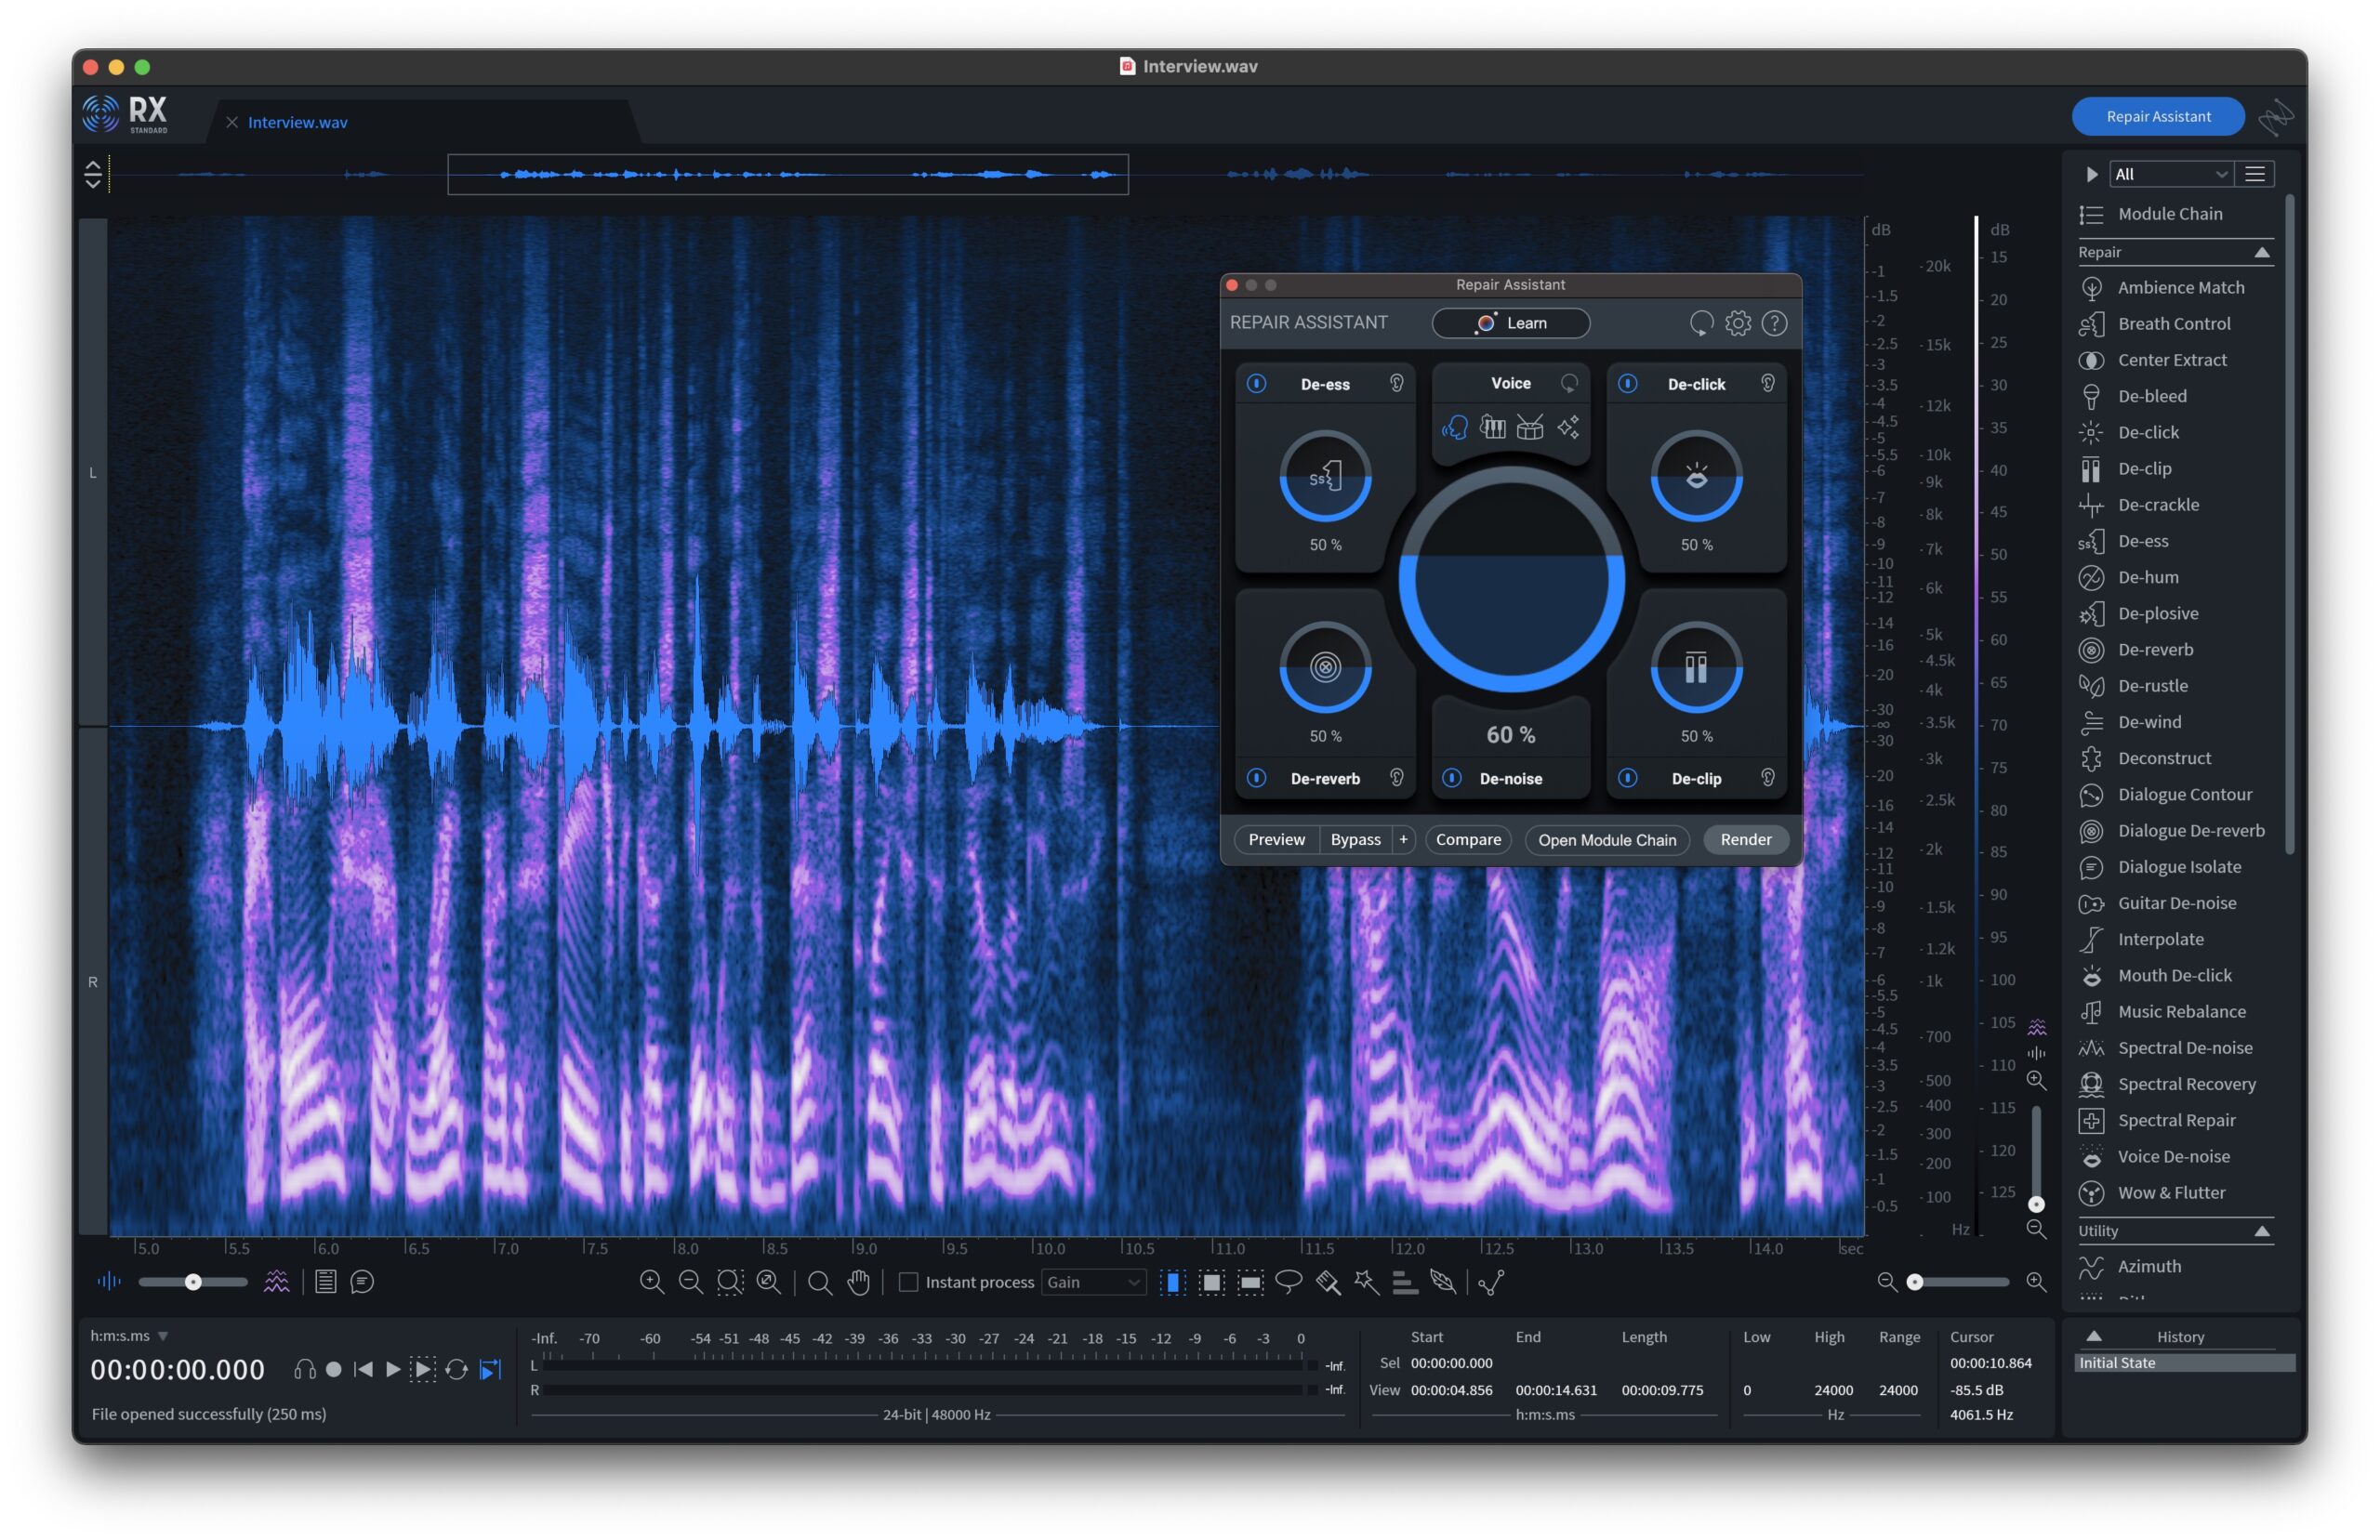
RX 10 showing a waveform in blue and a time-frequency spectrogram in orange.
RX 10 then lets you go in and edit this spectrogram image Photoshop-style, in order to make focused changes to the original audio file. Annoying features like clicks, pops, and background noise can easily be pinpointed and erased without affecting the rest of the recording, thanks to how the sound is being represented in the frequency domain (rather than in the time domain).
Get creative
Spectral editing and processing also have creative uses, too. In order to create the track “Formula,” Aphex Twin did a bit of reverse engineering involving the time-frequency domain. He actually loaded a photograph of a face (likely his own) into an audio tool called MetaSynth and had it act as the spectrogram itself. You can also hear the result of a spiral image being processed as a spectrogram towards the end of his track “Windowlicker.”
The moral of the story here? Yes, there’s more than one way to represent sound—and yes, there’s absolutely nothing stopping you from listening to your own face.
Explore the frequency domain with iZotope’s RX 10:
October 24, 2022